Now Available on the S&P Global Platform
Snowflake | Xpressfeed
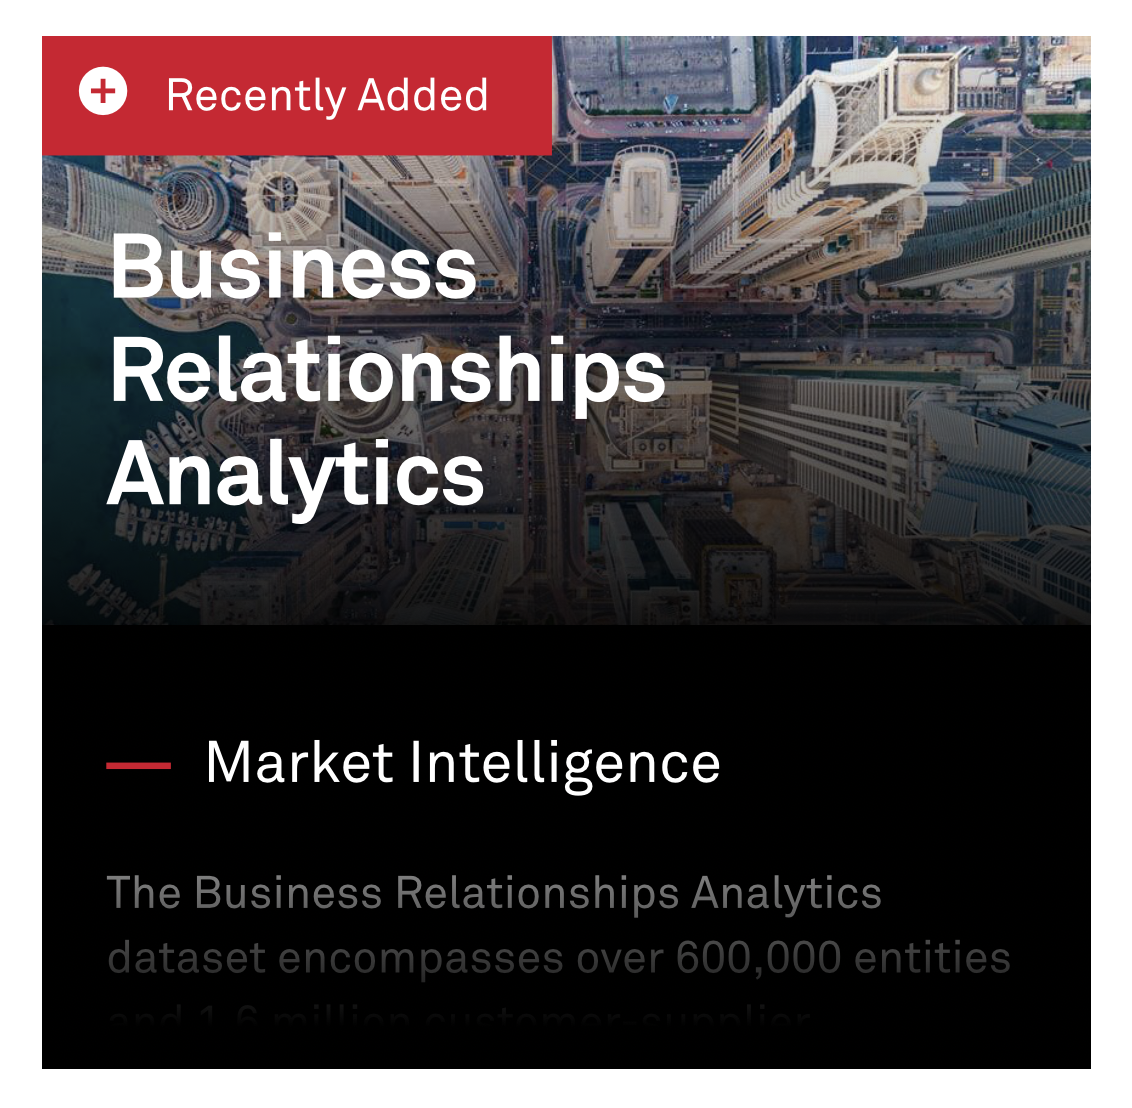
Business Relationship Analytics is now live on S&P—giving institutional investors trusted access to our AI-powered relationship analytics and capital flow intelligence.
Explore on S&P Global ➔
![]()


.svg)


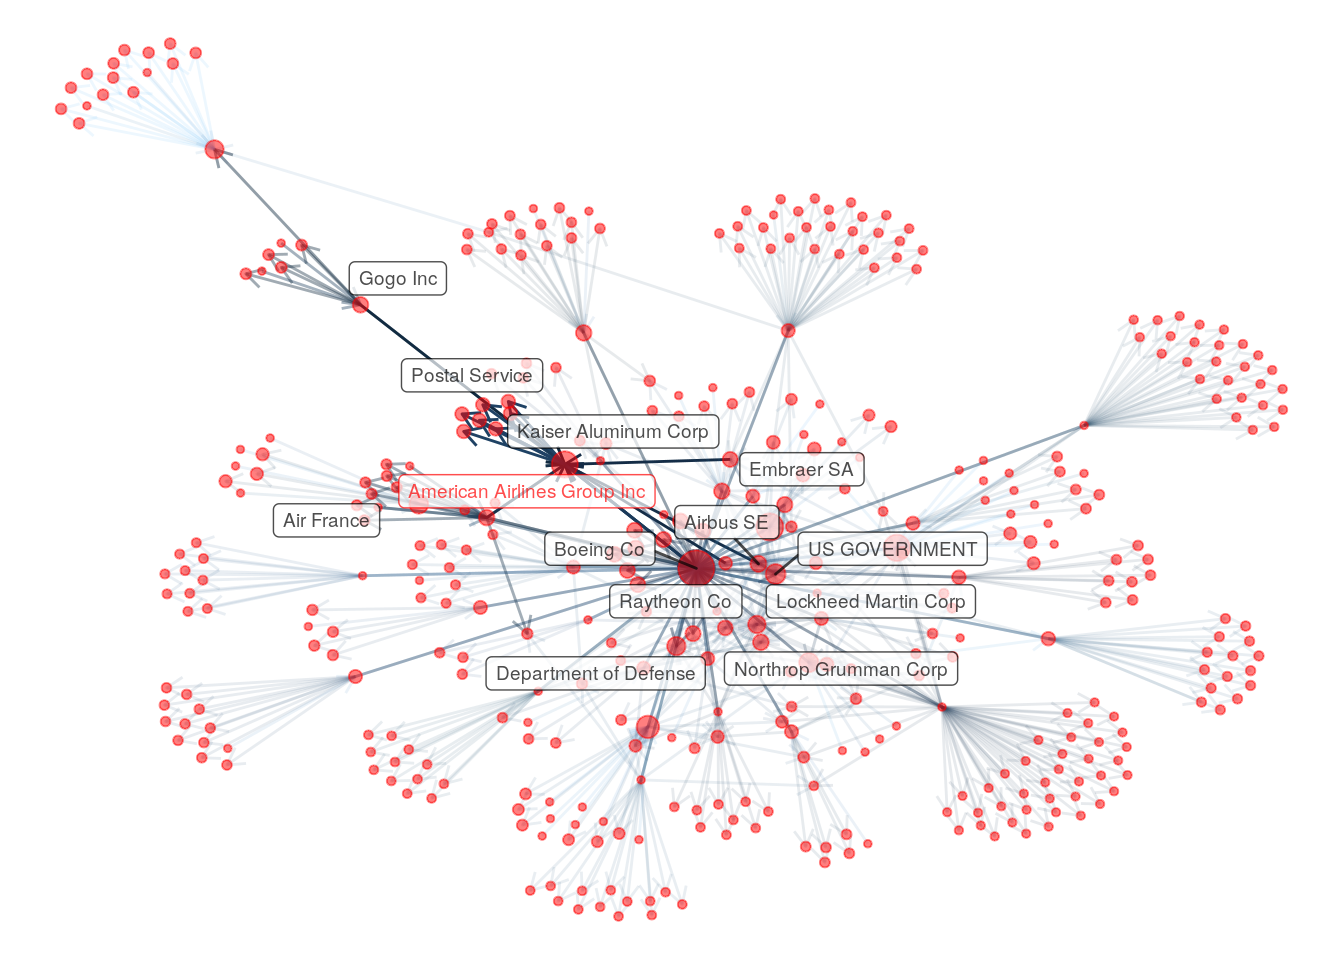
Seeing the Economy as It Really Is
Discover how RedGraphs maps the real flow of money between companies — revealing what truly drives markets, risk, and opportunity.
Read the Blog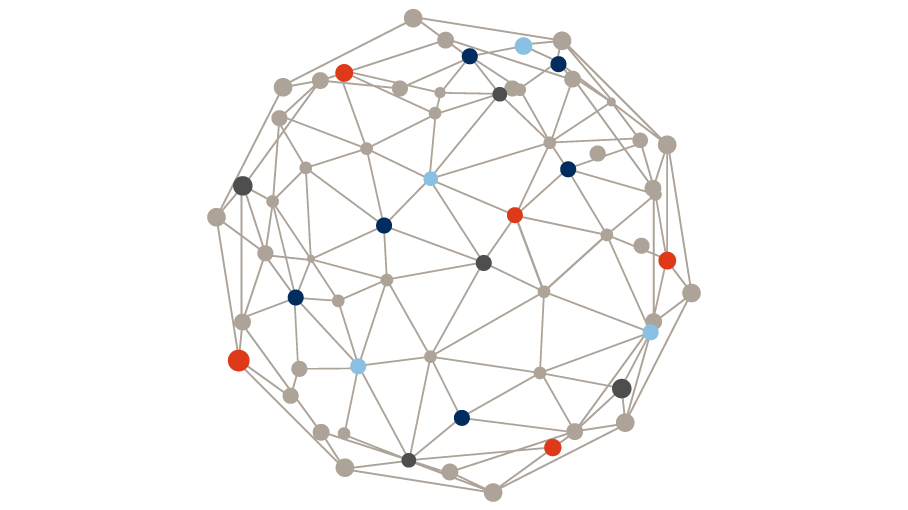
We’ve Mapped Global Money Flows. Everyone Else Is Guessing
RedGraphs uses fine-tuned LLMs and proprietary AI to map global money flows, customer-supplier links, and risk signals before anyone else can.
Read the Blog
Introducing Strategic Role Clustering: A New Lens for Thematic Investing
In a market crowded with sector labels and style boxes, investors are increasingly looking for new sources of insight—ones that cut through traditional classifications and surface how companies actually function in the economy.
Read the Blog
Interpreting Network Analytics
A practical guide to interpreting network analytics scores—including degree centrality, eigenvector centrality, betweenness, closeness, and more. Learn how these metrics reveal a company’s strategic position in the market and power advanced clustering, influence modeling, and alpha generation.
Explore the Network Guide
How Supply Chain Shifts Shape Investment Decisions: Lessons from GM
The key insight? Companies that proactively adjust their supply networks in response to policy changes, economic shifts, and competitive pressures tend to build resilience and long-term stability—a critical factor for investors assessing risk and opportunity.
Read the Blog
How Tariffs Reshaped Supply Chains: A Network Analysis Perspective
The last Trump administration’s tariff policies triggered structural changes in global supply chains, with targeted firms adjusting significantly more than their non-targeted counterparts.
Read our Latest Analysis
Resource name
A description of the resource being shared. Just a couple of sentences should be just right.
Download