RedGraphs Research Hub: Insights That Drive Alpha
Explore key takeaways from our latest research and whitepapers
Introduction
When applying conventional trading strategies to timely structured supply chain data, further explained in this article, our research indicates that there is ample opportunity to generate positive alpha up to the range of 6.7%.
Imagine a scenario where an ongoing pandemic hits the developed world causing immediate disruptions to supply chains and global travel. How would that impact Boeing, an important supplier to American Airlines? How would that impact Kaiser Aluminium, an important supplier to Boeing? First-degree relations of suppliers and customers are well documented and aware for most analysts, however using the highly advanced RedGraphs dataset the deeper relationships, the second or third degree, can be modeled and investigated to generate positive alpha.
A simplified view of the American Airlines' n-Tier supply chain

What is Low-Latency and Complete Supply Chain Data?
Supply chain data consists of a comprehensive mapping of a company with respect to its customers, suppliers and the global economy. Whilst the first and in some cases second tier of these relationships are evident through regulatory filings, uncovering the deeper network and the nth tier of a supply chain is an arduous task.
Previously, the extraction of this data required the manual review and compilation of filing documents, which is often prone to errors and neglect. However, with the embracement and growth of machine learning techniques in the industry it is now possible to generate an exhaustive database of companies and their supply chains with minimal delay after publication, and connect the missing links.
This automation provides a higher degree of accuracy as well as timeliness to the dataset. The uniqueness of this approach has numerous practical applications, amongst them is making investment decisions more profitable.
With this data, users can accurately see the financial inflows and outflows within a company, as well as of the company’s suppliers and customers. Thereby granting them an accurate map of the inter-linked nature of global supply chains. Furthermore, the dataset can also provide clarity towards how important certain customers and suppliers are to a company. For example if a company has only a few customers, those customers would enjoy a greater degree of importance than a company which has many customers.
Trading Strategies
It is well documented how in the current economy companies are increasingly becoming more interconnected, however to what extent?
The answers to this question can be easily answered by having access to a comprehensive supply chain dataset that can accurately map and showcase the importance individual customers and suppliers have on a company’s performance.
The apparent application of this data can be for portfolio managers and traders, who can benefit from processing and adopting trading strategies using this data.
We developed quintile portfolios and devised various trading strategies based on the supply chain network connections between companies.

Return Momentum Strategy
The stock performances of related companies to some extent can forecast the performance of a target companies stock.
Using the supply-chain data, we can isolate the performance of customers and suppliers past stock performances. This is because if a company’s customers are doing well then some degree of that positive performance should be translated up the supply chain. The same principle applies if a company’s suppliers are doing well, where the stock of a customer should rise only after the stock of a supplier rises.
In this strategy, the long-short portfolio is compiled by going long in the highest and short in the lowest position in the quintile portfolios. This strategy assumes that when a company reports lower revenue, this information will be immediately priced into the stock.
However, there will be a time lag of sorts before the related companies can react accordingly. This assumption is crucial for this strategy because it seeks to capitalise on the time lag of the related companies using the momentum signals of the original company.

Introduction
This strategy is part of a series of strategies we will post based on the insightful research paper by Martin Geissmann and Eric McGill titled 'The Value of Timely Supply Chain Data'. This paper derived various trading signals based on the network connections between companies and found many alpha generating long-short strategies involving customer and supplier momentum, fundamental profitability factors, unlisted companies and complex interactions.
Overview
In return momentum strategies we look first at customers’ and then at suppliers’ past stock performance. The notion of looking at customers is straightforward: a company should be doing well if its customers are doing well (which should be reflected in an increase in everyone’s market valuation). One step up the supply chain, the suppliers of that one company should also be doing well.
The same mechanism for suppliers is a bit less intuitive (i.e. a company’s stock is doing well if its suppliers are doing well), but could reflect suppliers providing better goods and services to their customers that improve the customers’ productivity (or inversely dropping goods or services that require replacement). For it to work, the stock of a customer of a company should rise after the rise of the stock of its supplier. As reported in the following, we actually find patterns in both directions, yet less clear for the supplier side. This is reasonable because suppliers changing their offerings is less frequent than customers simply purchasing more or less of the same offerings.
Results
The graph below shows the performance of a return momentum strategy with a return lag of one month on all direct customers. The strategy delivers a SR of 1.07, and a significant CAPM alpha of 6.7% (annualised). Positive returns could also be found for the six and twelve months lagged direct customer momentum.
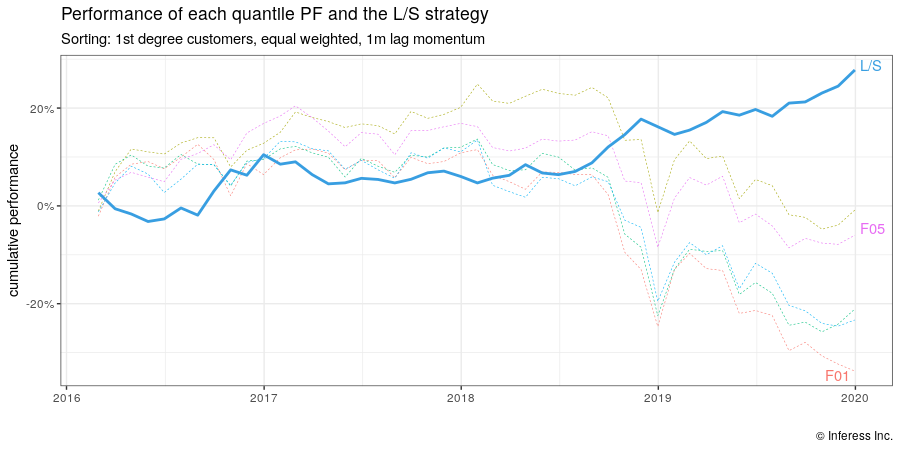
Momentum strategies on direct suppliers could also be identified to have delivered positive (yet weaker) returns. While their CAPM alpha was mostly insignificant, the loading on the Fama French and momentum factor was small and insignificant, which shows that their performance is not driven by systematic market momentum. The same observation could also be made for the momentum strategies on the customer side, and implies that neither is fully incorporated into the stock market.
Looking at second degree customers, we also find the L/S strategy to have delivered positive abnormal returns, see graph below. The strategies on all momentum lags resulted in positively performing L/S portfolios, with the six month lagged signal on the second degree customers performance delivering the highest SR of 0.92.
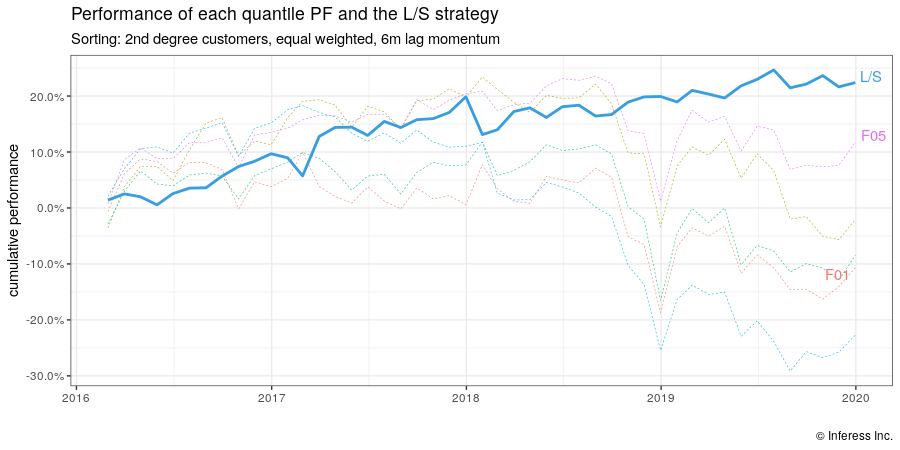
The momentum strategy on first degree customers performed best with the shortest lag (1 month) but declined significantly with longer lags. The same momentum strategy on second degree customers delivered better results with a six months lag. This supports the argument of delayed spread of information across the network. On the company itself, information is quickly priced in, whereas it takes some time to spread to other companies up the supply chain as analysts slowly incorporate the information.
Also as expected, the less intuitive and less frequent supplier side momentum performance is indeed lower. A company’s value does not seem to be influenced much by an idiosyncratic move in its suppliers’ stock as opposed to its customers’ stock.
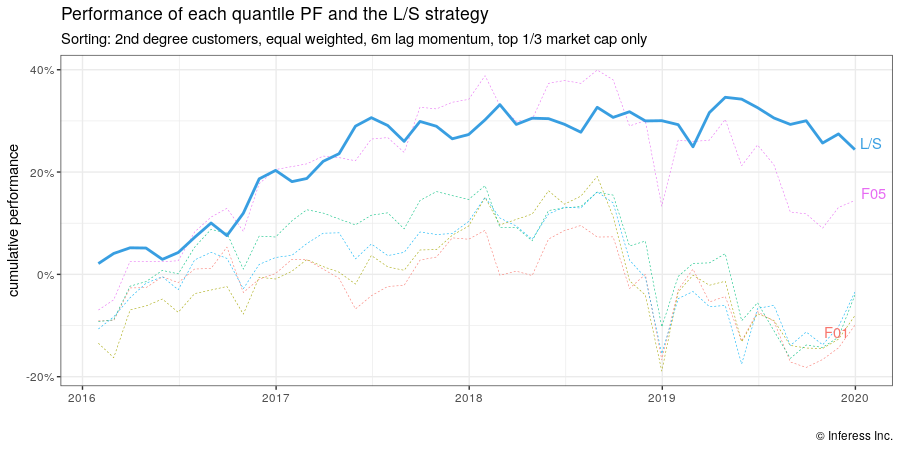
One possible explanation for our signals’ performance is that smaller capitalisation stocks are generally covered by fewer analysts. Therefore, one might expect that those stocks exhibit higher market inefficiencies and would be more profitable in a supply chain momentum strategy. To evaluate such patterns, we form conditional double-sorted portfolios, i.e. first sorting the equities according to their market capitalisation (where we use three quantiles low/medium/high), and second sorting for the momentum signal as before.
Contrary to the hypothesis, we do not find better performance with small-caps. This indicates that profound knowledge on the supply chain is relevant for all company sizes, small to large. For example, the large cap (top 1/3) subset shows a clear pattern in quantile portfolio returns according to the second degree customers (see graph below). We reason that while large caps are more covered by analysts, those do not necessarily take into account the elevated complexity of those companies’ supply chain connections. This bodes well for the long-term success of a supply chain trading strategy.
Fundamental Flow Factors Strategy
Fundamental flow factors strategy focuses on a companies' fundamental metrics. Factors computed from related companies’ fundamentals such as the return on equity (ROE), return on assets (ROA), or the earning yield are used to predict the performance of the target company’s stock performance.
Interestingly, performance is stronger in strategies based on signals from the suppliers ROE and earnings yield. This backs the intuition that if companies further up the supply chain are performing strongly, then the target company contributes to that strong performance by overpaying, hence it will perform worse than its peers. Furthermore, the Sharpe Ratio is higher on a supplier’s metrics than it is for a customer's metrics, even though the same long-short strategy yields positive returns on both.

Overview
Fundamental flow factors strategy focuses on a companies' fundamental metrics. Factors computed from related companies’ fundamentals such as the return on equity (ROE), return on assets (ROA), or the earning yield are used to predict the performance of the target company’s stock performance.
Results
Using the related companies recently reported fundamentals (and especially the change in fundamentals) is an appealing approach to forming portfolios.
For financial metrics, we wanted to invert the portfolio construction method used above. Instead of building the L/S portfolio with a long position from the highest quantile and a short position from the lowest quantile, we choose the opposite. The long exposure would be on stocks whose peers recently had a decrease in a metric and a short exposure on stocks whose peers recently had an increase. The logic is that if suppliers (or customers) of a company report increasing profit margins, ROE, ROA, or earning yields, this indicates that they siphon off a larger share of the total value created as opposed to just sending more funds to their suppliers. Stock performance can come from increasing revenues or increasing margins, and it is important to check both.
We find positive performances especially in strategies based on signals from the supplier ROE and earning yield (see table 1). This backs the hypothesis that if further up the supply chain increased profit margins are achieved, the company in focus is likely to be contributing to that increased profitability by overpaying. As a result, the company tends to perform worse than its peers.
Table 1: Sharpe ratio of fundamental flow strategies

The same L/S strategies formed on customers’ metrics still lead to positive returns, however with considerably lower SR. (See graph below)
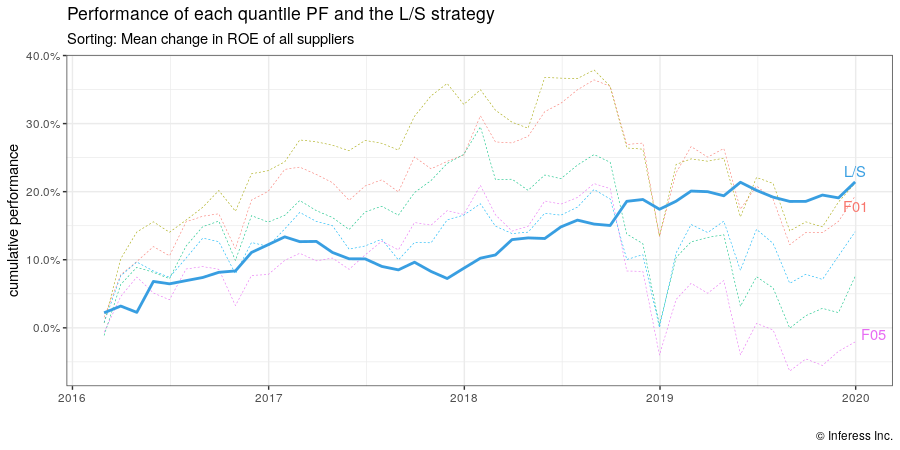
We do not report the results on the portfolios constructed from the absolute financial metrics figures (as opposed to the changes), mainly due to them giving ambiguous results. It has to be assumed that the bare figures do not mean much as a static snapshot of a supply chain in temporary equilibrium. In other words, there is nothing inherently special about any given level of ROE, ROA, etc. for generating subsequent returns in the stock market. Rather, it is the changes in these metrics and their associated impact on the supply chain that matters. Markets can also be driven by surprises, i.e. deviations from the consensus’ expectations, but we lack meaningful historical data to perform such a backtest.
By Alan Gigi and Martin Geissmann
Link Interaction Factors Strategy
This strategy revolves around processing the complex network of customer-supplier and use network statistics to provide a systems view of a company’s importance within the overall economy.
Expectedly, the results indicate a positive return if the company reported additional outward degrees i.e. by acquiring new customers. Furthermore, increases in the number of inward, outward and total degrees of unlisted companies also produce positive returns. Finally, after computing centrality scores we found that companies with higher centrality scores outperform. Indicating that more interconnected companies on average perform better.

Overview
This strategy revolves around processing the complex network of customer-supplier and use network statistics to provide a systems view of a company’s importance within the overall economy.
A more complex strategy using interaction factors is derived from the following two key steps:- We calculated the change in the number of customers and suppliers, including changes in unlisted companies such as government or near government entities. Why? To accommodate customers that are less exposed to the volatility of the market and are willing to overpay above market prices.
- We looked at the eigenvector centrality measure, representing the importance of a company in the global economy and it most closely follows the flow of money in the economy. This allows us to analyze performance on multiple tiers of the supply chain.
Results
We initially used the mere number of first degrees inward, outward, or total, as signals, but the result in a L/S strategy was inconclusive. While similar to Zhao et al. (2015), some degree ratios (e.g. number of degrees divided by market capitalization) deliver better results, but such signals are seemingly heavily synthesized (data dredging) and don’t reflect an underlying base truth.
In contrast, using changes in the number of degrees give better results. As shown in Table 1, we get positive returns (yet comparably small SR) for the change in number of outward degrees. That is to say, those companies that recently reported additional outward connections (i.e. new customers) outperformed, which makes sense.
We also report the change in unlisted degrees. Those are trading partners that are not listed on a stock exchange, which includes private companies but also several government or government- near entities (US Government, Department of Defense, United Nations etc.). This is motivated by the idea that such customers tend to be less prone to economic cycles and might tend to pay above market prices as they focus on a longer-term horizon. We observe that an increase in connections with unlisted companies resulted in a better performance (SR above 0.7 for all inward/outward/total), which clearly reflects the value of gathering data beyond the standard filings.
Table 1: Sharpe ratio of fundamental flow strategies

To incorporate graph characteristics beyond the first degree, we have to look at centrality measures. Centrality gives a score of importance to each node in a network. While several approaches to measuring the centrality have been proposed, we chose the eigenvector centrality as it most closely follows the path of money flowing through the economy.
As expected, we find better performances in companies with higher centrality scores. More interconnected companies on average outperform on average. Interestingly, we do not observe a significant loading of the L/S portfolio’s return series on the the Fama/French’s SMB factor (nor on their other factors), indicating that the centrality incorporates further characteristics beyond a company just being small or large. Since complex network analytics are difficult to intuitively process, this is a logical finding.
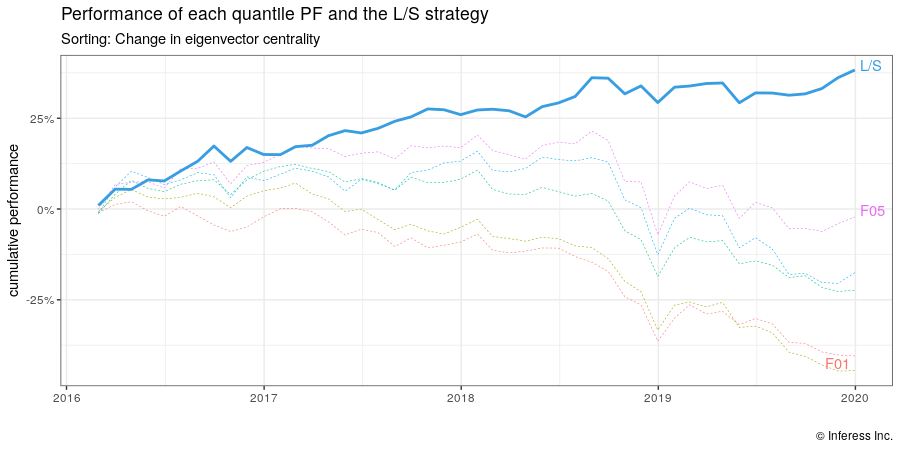
We also find value in the change of the centrality score. Companies whose centrality has recently increased tend to outperform. The L/S strategy delivers a SR of 1.11, see Table 2.
Table 2: Sharpe ratio of centrality strategies

By Alan Gigi and Martin Geissmann
