Understanding the Past to Predict the Future The global supply chain is a living, breathing network...
Vishal Puri
1 min read.

How Tariffs Reshaped Supply Chains: A Network Analysis Perspective
During the last Trump administration, firms targeted by tariffs saw a 17% change in their overall supply chain strategy from 2017 to 2019—5 percentage points higher than their non-targeted peers. Certain industries faced even more significant disruptions, with Automobiles & Components experiencing a staggering 37% shift in supply chain structures. Using RedGraphs' advanced business network analysis, we can uncover the underlying mechanisms behind these shifts and their broader implications for global trade and investment.
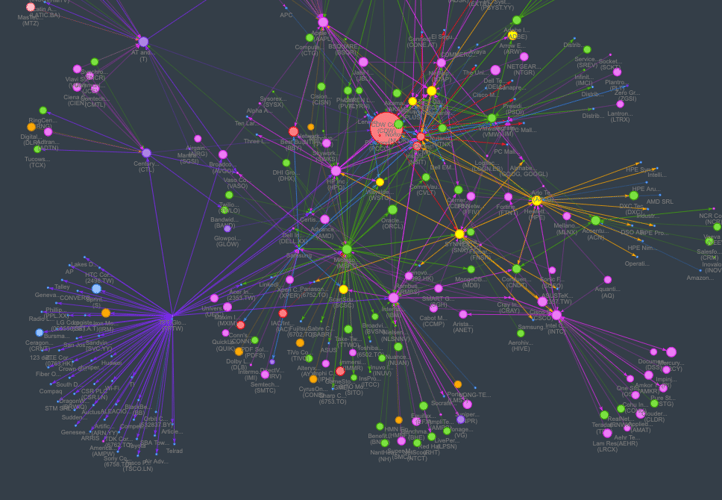
Mapping Supply Chain Disruptions
RedGraphs’ AI-driven relationship mapping allows us to visualize the structural shifts in business networks caused by tariffs. By analyzing supply chain links, capital flows, and trade dependencies, we see clear patterns emerging:
- Supplier Diversification & Realignment – Tariff-targeted firms sought to reduce reliance on single-country suppliers, particularly those in China, leading to increased regional trade partnerships and reshoring efforts.
- Capital Flow Redistribution – Increased costs due to tariffs forced businesses to reallocate investment toward alternative sourcing regions, including Mexico, Vietnam, and domestic suppliers.
- Market Influence Shifts – Firms with strong global ties adapted more efficiently, while smaller, less diversified firms faced greater financial strain due to higher input costs.
Case Study: The Auto Industry’s Supply Chain Shift
The 37% disruption in the Automobiles & Components sector was among the most severe. RedGraphs' network analysis highlights:
- A surge in new supplier relationships in Canada and Mexico, aligning with USMCA trade agreements.
- Increased capital flow into domestic manufacturing, driven by subsidies and tax incentives to encourage reshoring.
- A decline in direct sourcing from China, replaced by secondary suppliers in Southeast Asia.
Investment & Policy Implications
For investors, understanding these shifts provides an edge in predicting which industries are most vulnerable—or adaptable—to future trade policies.
- Quantitative asset managers can leverage RedGraphs' network models to assess systemic risks in global supply chains.
- Fundamental investors can pinpoint companies poised to benefit from new supplier relationships and regional trade shifts.
- Policymakers can use network intelligence to craft data-driven trade policies that minimize economic disruptions.
Conclusion
The last Trump administration’s tariff policies triggered structural changes in global supply chains, with targeted firms adjusting at a significantly higher rate than their non-targeted counterparts. By using RedGraphs’ financial network analysis, businesses, investors, and policymakers can gain unparalleled visibility into these complex shifts, ensuring more informed decision-making in an evolving global trade landscape.